
How Does Ajaz Patel Stack Up Against Past Blackcaps Test Spinners?

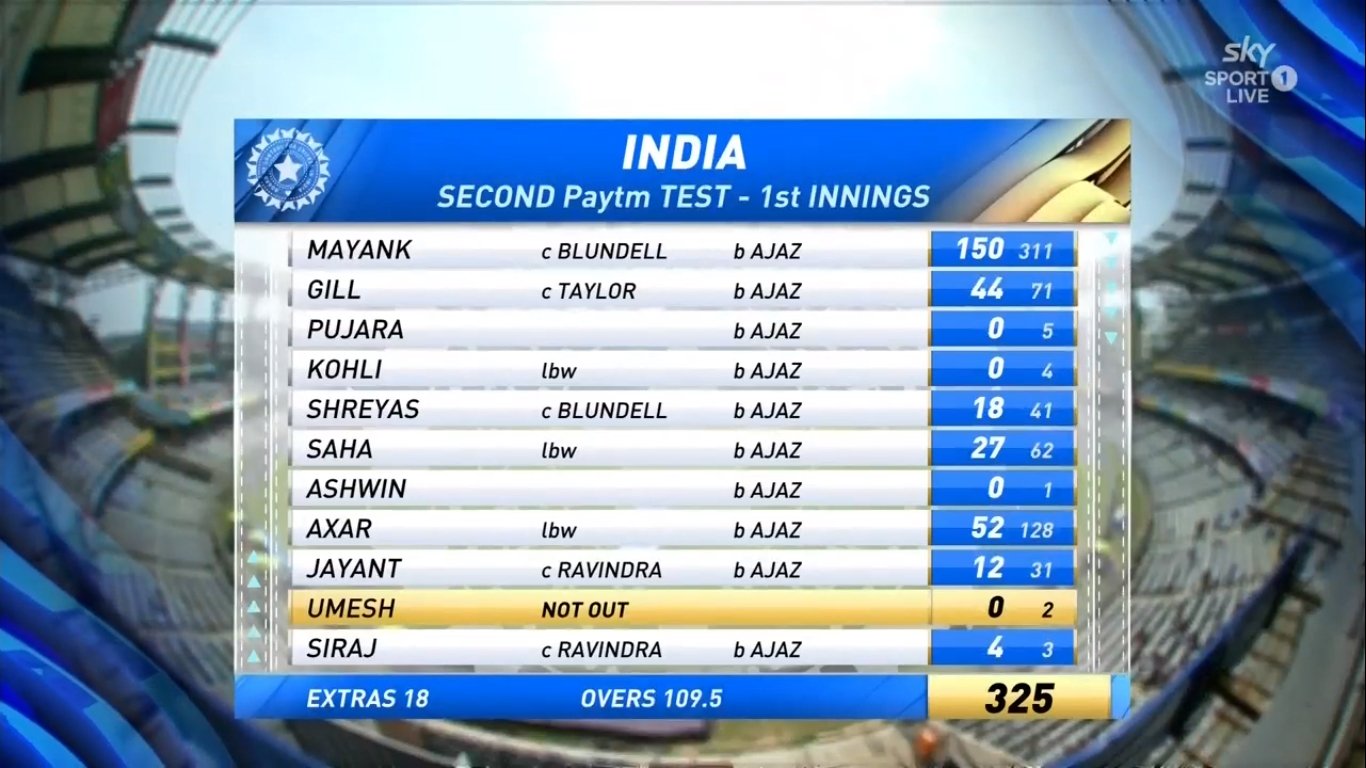
Ten wickets in a single innings will do some wild things to your stats. Almost a third of Ajaz Patel’s current Test wicket tally was taken in his eleventh match: the (heavy) loss to India at Mumbai, the city of his birth. The West Auckland Prince of Mumbai with 14 wickets in that one after 29 in 10 matches previously. Just the third man in the ENTIRE HISTORY OF TEST CRICKET to take 10-for in an innings after Jim Laker (10/53 for England vs Australia in 1956) and Anil Kumble (10/76 for India vs Pakistan in 1999). Ajaz Patel took 10/119 in the first innings and had match figures of 14/225... the best figures ever in a losing effort.
Those 14 wickets took 73.5 overs to earn and came at the cost of the 225 runs which is the second most runs that a kiwi Test bowler has ever allowed in a single Test – Stephen Boock once took 1/229 in a match against Pakistan in 1989 (70 overs). 443 total deliveries is also the second most by a New Zealander after Hedley Howarth’s 444 (2/138 vs West Indies in 1972). But guess what? 14 wickets for 225 runs is an average of 16.07 while 14 wickets in 73.5 overs is a strike-rate of 31.64 and both of those numbers are amazing.
Not that his previous stats were anything sketchy to begin with. Ajaz Patel’s first ten matches saw him post an average of 32.48 with the ball including two five-fors and this was despite three wicketless Tests in Aotearoa. Those were excellent numbers for a kiwi spinner already... so when you add a cheeky ten-bagger to the mix then it gets into some glorious territory.
We’re talking about 43 total wickets in Ajaz’s Test career to date. Picked up at an average of 27.13 and a strike-rate of 57.7 – numbers that don’t quite match up with the best in the business from this current era (Ravi Ashwin: 400wickets/24.12ave/52.1sr) but you have to understand something here: Ajaz Patel is a New Zealand spinner.
This dude has come up bowling on roads and green tops. Not a lot on offer to aid his particular expertise. He’s a slow left-arm orthodox bowler from the Land of the Long White Cloud where spinners exist to complement the sizzlin’ seamers. That’s just how it’s always been. Daniel Vettori, Aotearoa’s finest ever spin bowler... had a Test average of 34.15 for his 361 wickets (362 if you include his ICC World XI stuff, which technically you have to). He, Nathan Lyon, and Harbhajan Singh are the only two guys in the all-time top ten for wickets by spinners with an average over 30 and DV wasn’t even close to that mark.
Most Test Wickets By Spinners
| Span | Nation | Career | Wickets | Ave | SR |
|---|---|---|---|---|---|
| Muttiah Muralitharan | SL | 1992-2010 | 800 | 22.72 | 55.0 |
| Shane Warne | AUS | 1992-2007 | 708 | 25.41 | 57.4 |
| Anil Kumble | IND | 1990-2008 | 619 | 29.65 | 65.9 |
| Rangana Herath | SL | 1999-2018 | 433 | 28.07 | 60.0 |
| Ravichandran Ashwin | IND | 2011-2021 | 427 | 24.12 | 52.1 |
| Harbhajan Singh | IND | 1998-2015 | 417 | 32.46 | 68.5 |
| Nathan Lyon | AUS | 2011-2021 | 403 | 32.07 | 64.3 |
| Daniel Vettori | NZ | 1997-2014 | 362 | 34.36 | 79.5 |
| Lance Gibbs | WI | 1958-1976 | 309 | 29.09 | 87.7 |
| Derek Underwood | ENG | 1966-1982 | 297 | 25.83 | 73.6 |
Dan Vettori was undeniably an amazing bowler. Absolutely brilliant, a genius level spinner who varied his flight and speeds and drift and angles with unparalleled subtlety. The point here isn’t that Dan Vettori wasn’t as good as people remember him or that his presence on that list is somehow fraudulent because of his average. The point is that not all stats are made equal.
Different countries offer different playing conditions which offer different assistance to different styles of players. So it stands to reason that a spinner who bowls predominantly on sub-continent pitches (in other words, someone from those regions playing all their home games there) is going to have better stats than a guy bowling stock stuff on a green-seamer at, like, Hagley Oval or Seddon Park. Ironically Seddon Park has a reputation for being one of the kiwi pitches where you’re more likely to consider a second (or first) spinning option but the recent stats seriously do not back that up.
In baseball they often do this thing where they adjust batting/pitching stats to account for the grounds in which they play. If your home ground is considered hitter-friendly because of the dimensions of the stadium or the altitude or whatever then a pitcher’s numbers will tend to reflect that over the course of a long season. It’s been claimed that you should add another five runs to a Test match opening batsmen’s average when comparing them to guys batting at 3-5 to account for openers having to face the new ball every single time. Building off those logical ideas, perhaps it’s worth shaving some runs off of kiwi spin averages in order to get more of a reflective idea of them.
Because get this: Ajaz Patel is the *only* Blackcaps spinner with a Test bowling average under 34 to have taken more than 5 Test wickets. The only one. There are no others. You may think Dan Vettori’s bowling average was a little bloated but it wipes the floor with everybody else to represent New Zealand with the lone recent exception of Ajaz Patel.
Might as well put that into table form to hammer home the proof. Here are all the spinners to have taken 15+ Test wickets for New Zealand. It’s a 24-man list, only two of whom have reached triple figures (note that there are 54 Blackcaps seamers with 15+ Test wickets and 12 of them with 100+)...
Realistically, Ajaz Patel is not going to stay at such a dark green level forever. He’s coming off a 10-for so you can naturally expect some regression to the mean over the next year or two. But he’s going to have to have some absolute shockers over the rest of his career not to be chilling up near the top of those averages when he hangs up the boots. He’s that far ahead right now.
If anything, that table only reinforces the greatness of Dan Vettori. He’s one fella other than Ajaz with a shade of green in both columns. Others with comparable strike-rates have much lower averages and vice versa. He’s the only one who could both keep the run-rate down and still threaten wickets. It was only within a decade of his Test debut that the first and so far only other New Zealand spinner to reach 100 Test wickets passed that milestone (shout out John Bracewell) and yet there’s Danny V with 361 of the buggers. He truly is like an oasis in the desert.
By the way, funky little comparison between the T20 Spin Kings of Mitchell Santner and Ish Sodhi. The reason those two bowl so well in tandem in the shortest form stuff is that Santner is so miserly with his economy rate that Sodhi can afford to risk boundaries in order to be aggressive in pursuit of wickets. Leg-spinning as an art form is imprecise but deadly. Finger spin is much easier to control than wrist-spin... but it gives you less turn and variation. So having of each allows them to elevate each other’s strengths.
Of course run rate doesn’t mean jack in Test cricket where there’s no over limit so that’s negatively affected Santner’s prospects in the longer form. Bad average and even worse strike-rate. Meanwhile Sodhi’s risk vs reward nature has also been held against him pretty harshly. Santner and Sodhi have identical wicket totals of 41 yet Sodhi has a worse average and a better strike-rate. In other words, he goes for more runs but he takes more wickets (his 41 wickets have come in seven fewer Tests). Yet Santner’s batting ability has earned him more opportunities, so it goes. It’ll be curious to see which of them next plays a Test now that Will Somerville’s window as the second spinner on away tours appears to have closed rather emphatically.
The type of players that a nation develops don’t appear at random. They are products of their place and time. If pitches offer more assistant to spin then more spinners will emerge – probably the main reason why kiwi batsmen seemed to struggle against the spin on that India tour compared to the host batters is that those host batters all came up facing copious spin at first class level and beneath that. It may not be easy but they’re used to it.
Let us now take a look at spin vs seam bowling averages by nation over the last ten years...
First off, fascinating lil glance at which countries host the most Test cricket in this era. Secondly, it’s those differentials at the end that you wanna look at most. Spin average minus seam average. Negatives mean the spinners are that much better than their seaming companions and positives mean the seamers are that much more potent. And Aotearoa features the single biggest differential.
Only two runs worse off than Australia... but the strike-rates are 11 balls apart. Translation: spinners in Australia concede more runs per over than spinners in NZ but they take wickets nearly two overs more regularly. Granted still at a rate that’s worse than any other host nation... but you get the idea. The average Test spinner – and this includes touring spinners as well as host spinners – requires nearly five additional overs per wicket in New Zealand compared to India or Sri Lanka. At a cost of more than twenty extra runs. Look at it, man. Spinners in NZ have averaged over fifty in the past decade. That’s about the mid-mark of Ross Taylor and Kane Williamson’s Test batting averages so any time a captain throws the ball to a spinner in NZ, they might as well be bowling to New Zealand’s finest ever Test partnership.
Let’s break it down further to individual grounds over the same time span...
Probably worth disregarding McLean Park for one Test against Zimbabwe back in 2012. Blackcaps scored 495/7 batting first with hundreds from Ross Taylor (122) and BJ Watling (102no) and then bowled Zimbabwe out for 51 and 143. Not exactly a fair representation for these purposes (plus they haven’t played a Test there since).
Some funky figures from the rest of them though. Bay Oval in Mount Maunganui could potentially shift things because it’s only recently become a Test venue with two matches so far. Both were thrillers in which the Blackcaps bowled their opposition (Pakistan and England) out in the final session of the day five to win. Mitchell Santner played in both, taking 5 total wickets at an average of 27.20 and strike-rate of 85.8. All of those wickets came in the second innings (he only bowled 6 overs in each first innings).
Hagley Oval in Christchurch is a crime scene for spinners. No surprises there. Main surprise elsewhere is just how similar Seddon Park in Hamilton is compared to Hagley. They’re practically identical for spinners in recent times, with Christchurch giving just a little more to the seamers. Also University Oval in Dunedin, despite being the furthest south Test venue in the country, is by far the most impartial ground we’ve got within the spin vs seam debate. Dan Vettori took 16 wickets there (21ave/53sr). Keshav Maharaj grabbed a five-for one time. Bruce Martin took 4/43 on debut against England there. Still dominated by seamers on the whole (note the strike-rate differential) but there have been a fair few draws there blowing the stats out and evening things up. Five outta eight Tests at Uni Oval have ended in stalemates.
Which brings us all the way back to Ajaz Patel because the crazy thing about his current numbers is that he’s never taken a wicket in Aotearoa. All 43 of his Test wickets have come overseas in England (4 @ 14ave/35sr), India (17 @ 24ave/44sr), UAE (13 @ 30ave/63sr), and Sri Lanka (9 @ 36ave/86sr). Compare that to his New Zealand figures where he’s played three matches and bowled 49.0 total overs for 106 runs and zero poles. Two of them in Wellington and one in Christchurch.
The Blackcaps’ best home eleven arguably doesn’t include a spinner at all. The four-pronged pace attack of Trent Boult, Tim Southee, Neil Wagner, and Kyle Jamieson is bowling most teams out twice on kiwi decks, don’t even worry about that. Hence why most of Patel’s work has come when playing on foreign pitches where that balance needs a dose more of the spinnerisms. Eventually that will change. That quartet won’t always be available. Guys will get injured or be rested. Some surfaces/conditions may make the temptation of a spinner too much to decline (the Blackcaps do have one Test at Mt Maunganui this upcoming summer although the other three are in Christchurch and Wellington). Further home matches will come along for Ajaz Patel. Just... maybe not a whole heap of them.
And to be honest, having just yarned about the spinners’ graveyard that is New Zealand, that might actually be the perfect formula for a kiwi spinner. Play all the away matches but only sporadic home ones. Feast out in the conditions that suit and then don’t let the statties swell up playing in home games where you’re practically a specialist fielder for the first half of the Test. It’s a balance that hasn’t done him too much harm so far. Can’t complain about having the best Blackcaps Test spinner’s average of all time.
Alrighty, support the work by chipping in on our Patreon page (where you’ll also get a bonus podcast that tends to include a lot of Blackcaps chat)
Also whack an ad, join our Substack mailing list, and spread the TNC gospel far and wide
Keep cool but care